
yup, there are more rear mount setups rolling around now and daysNew Jersey wrote:its called the surface area of 8-10ft of tubingZXdriver wrote:I noticed no intercooler...? How does that work?
Rear Mount Turbo is very effective.
Re: Rear Mount Turbo is very effective.
-
raremotive

- Posts: 3581
- Joined: Sun Oct 07, 2007 8:54 pm
- Car: 04 Infiniti G35
- Location: Stuck in the middle.
Re: Rear Mount Turbo is very effective.
Actually it's the limited boost that allows it to work. Non-intercooled turbo engines can only regain pumping losses, not help make additional power.New Jersey wrote:its called the surface area of 8-10ft of tubingZXdriver wrote:I noticed no intercooler...? How does that work?

Re: Rear Mount Turbo is very effective.
interesting
-
New Jersey
- Posts: 127
- Joined: Tue Nov 16, 2010 9:09 am
- Car: 1997 Infiniti Q45
1990 Nissan 300ZX
Re: Rear Mount Turbo is very effective.
untrueRare_f8 wrote: Actually it's the limited boost that allows it to work. Non-intercooled turbo engines can only regain pumping losses, not help make additional power.

Re: Rear Mount Turbo is very effective.
This thread has a lot of very "interesting" information. 80% of which is completely incorrect.
To each there own, but one word of caution about that cheap ebay Chinese junk: when that turbo eats itself, all that metal will be nicely shot into your motor. Enjoy it all while you can before buying a new motor.
To each there own, but one word of caution about that cheap ebay Chinese junk: when that turbo eats itself, all that metal will be nicely shot into your motor. Enjoy it all while you can before buying a new motor.
-
NolimitZ32

- Posts: 7042
- Joined: Fri Jun 27, 2008 9:07 am
- Car: 91 AG2 2+0 TTMT swap/E39 BMW 540i6/E53 4.6is Dinan S3
- Location: Houston, TX
Re: Rear Mount Turbo is very effective.
Ive seen instances of the Chinese turbos dropping the bearings but I don't recollect a single instance of the compressor wheel ever disintegrating, these turbos use thicker blades so technically they have less of a chance of disintegrating than say garret or MHI units. Its the pesky RB26DETT GT28s (the ceramic wheel ones) that have a tendency to let go when pushed to far.
As far as un-intercooled turbos go I know for a fact that they are still much more efficient than just regaining pumping losses because there have been a few cars produced throughout the years that have had factory un-intercooled turbo systems and have managed to make a formidable amount of power over their NA counterparts. (ie EJ22T)
As far as un-intercooled turbos go I know for a fact that they are still much more efficient than just regaining pumping losses because there have been a few cars produced throughout the years that have had factory un-intercooled turbo systems and have managed to make a formidable amount of power over their NA counterparts. (ie EJ22T)
-
raremotive
- Posts: 3581
- Joined: Sun Oct 07, 2007 8:54 pm
- Car: 04 Infiniti G35
- Location: Stuck in the middle.
Re: Rear Mount Turbo is very effective.
EJ22T made a little less than 30 hp over the NA counterpart in factory trim.
It's basic thermodynamics and I think this link describes the Pressure-Volume (PV) diagram for SI engine:
http://www.mechadyne-int.com/vva-refere ... -si-engine
The area inside the two loops is equal to net(total) work, ie... what you see at wheels, neglecting drivetrain losses and so forth. The top is positive work, and the loop below is negative work. Pumping loop is quite a large chunk in the diagram, it's always resisting forward motion. This loss can be evident when you let off the throttle or even shift to the next gear without throttling. However, once the boost reaches atmospheric there is no more pumping losses.
Of course this approach can ignore heat loss and friction.
Re: Rear Mount Turbo is very effective.
I personally have seen it at least a dozen times in the last year.NolimitZ32 wrote:Ive seen instances of the Chinese turbos dropping the bearings but I don't recollect a single instance of the compressor wheel ever disintegrating, these turbos use thicker blades so technically they have less of a chance of disintegrating than say garret or MHI units. Its the pesky RB26DETT GT28s (the ceramic wheel ones) that have a tendency to let go when pushed to far.
(ie EJ22T)
-
DCaff300ZX

- Posts: 4202
- Joined: Sun Jun 14, 2009 8:18 am
- Car: .
1993 CRP TT- Modified - Location: Tacoma, Washington
Re: Rear Mount Turbo is very effective.
New Jersey wrote:untrueRare_f8 wrote: Actually it's the limited boost that allows it to work. Non-intercooled turbo engines can only regain pumping losses, not help make additional power.
Why untrue?
Reasons to dispute the claim please!
-
Ace2cool

- Posts: 11650
- Joined: Sun Apr 20, 2008 5:21 pm
- Car: 1991 Nissan 300ZX TT
1966 Datsun Fairlady 1600
2005 Suzuki GSX-R 600
1974 Honda CB550 Four
2009 Ford F150 Lariat - Location: Murfreesboro, TN
Re: Rear Mount Turbo is very effective.
+1.DCaff300ZX wrote:New Jersey wrote: untrue
Why untrue?
Reasons to dispute the claim please!
-
raremotive
- Posts: 3581
- Joined: Sun Oct 07, 2007 8:54 pm
- Car: 04 Infiniti G35
- Location: Stuck in the middle.
Re: Rear Mount Turbo is very effective.
^ maybe SBC can enlighten us?
-
New Jersey
- Posts: 127
- Joined: Tue Nov 16, 2010 9:09 am
- Car: 1997 Infiniti Q45
1990 Nissan 300ZX
Re: Rear Mount Turbo is very effective.
nah, just do a google search
there are tons of cars that are rear mount turbo non intercooled that way more than "make up for pumping losses"
that was just some ignorant bs that guy posted
tons of misinformation on the internet and that's how it usually starts on forums.
there are tons of cars that are rear mount turbo non intercooled that way more than "make up for pumping losses"
that was just some ignorant bs that guy posted
tons of misinformation on the internet and that's how it usually starts on forums.
-
raremotive
- Posts: 3581
- Joined: Sun Oct 07, 2007 8:54 pm
- Car: 04 Infiniti G35
- Location: Stuck in the middle.
Re: Rear Mount Turbo is very effective.
On contrary.
Pumping losses is the work the the engine does to pump air in. The intake system is under a vacuum drawing air in. The pumping loss is square of the engine speed and can rob the engine roughly 18% of it's power. This can be felt if you let off the throttle, downshift without throttle or even go down a hill in gear.
Adding a turbocharger heats the air up and pressurizes the intake system. Let's say on a nice day of 70*F, boosting at 6 PSI at sea level.
The temperature after the turbo will be:
Tout = Tin + ((Tinx(-1x(Pout/Pin)^0.263))/n)
Where:
Tout - Temperature after turbo in rankine (R=*F+460)
Tin - Temperature before turbo in rankine
Pout - Pressure after turbo, absolute pressure ... ie ..you have 10lb of boost on the gauge.. add atmosphereic to get absolute
Pin - Pressure before turbo, often slight vacuum, absolute pressure
n - is the efficiency of the turbo... look at the turbo compressor map to determine where it falls in the efficiency range. Most average around 70%
plug in 70*F, 20.7 psia (6 psi boost), .7 for (n as in 70%) and you get a Tout of 158*F
Now, plug it into the density ratio equation to determine the density after the turbo.
DR = (Tin/Tout)*(Pout/Pin)
Same before, remember temperatures are in Rankines and pressures are absolute. DR comes out to be 1.24.
This means that the density of the air after the turbo is 1.24 more than the density than the inlet. Dout = Din * 1.24...
However, since the engine needs to be accomindated for the higher inlet temperatures the ignition timing is adjusted to compensate. The power output is the same even with the slight increase of air.
What's left is the pressure. That helps the engine by having to do less work, and recover lost power explained below.
Just doing an energy analysis on the engine or thermodynamics. The engine experiences a low pressure cycle, negative work, and a high pressure cycle, positive work. Add them together yields net work or what you see at the flywheel. The negative work is... pumping loss.
This is a general Pressure-Volume (P-V) diagram for an actual(opposed to ideal) 4 - stroke engine:

To further explain this diagram, the area inside loop is work, top minus bottom. It represents the 4 stroke in a single rpm in the range. Top side of the loop is compression, combustion and expansion. While the bottom is exhaust and intake.
This is an even more detailed general P-V Diagram:
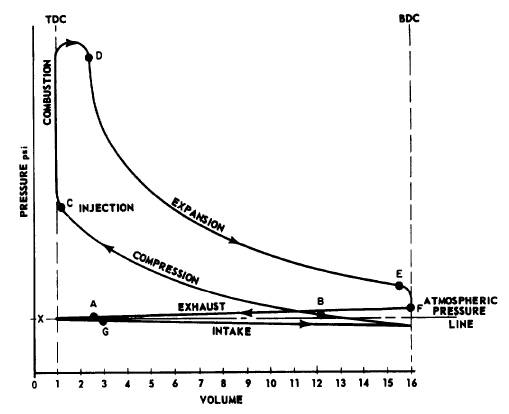
You can get a general idea at each phase what internally is happening inside the engine. Meaning pressure increasing as volume is shrinking during compression. Pressure growing at combustion. And most noticeably, intake pressures falling below atmosphereic pressure. This takes work to create the vacuum, which means your engine is making less power to suck air in.
Notice that if intake did not fall below atmosphereic pressure that the area of the low pressure cycle would be smaller? And therefore, net work..power at the flywheel... would be larger.
And that's why a pressure increase actually helps the engine recover it's power.
I will not say a rear mount turbo cannot make more positive power. But it's all dependent on inlet temps.
Cheers.
Pumping losses is the work the the engine does to pump air in. The intake system is under a vacuum drawing air in. The pumping loss is square of the engine speed and can rob the engine roughly 18% of it's power. This can be felt if you let off the throttle, downshift without throttle or even go down a hill in gear.
Adding a turbocharger heats the air up and pressurizes the intake system. Let's say on a nice day of 70*F, boosting at 6 PSI at sea level.
The temperature after the turbo will be:
Tout = Tin + ((Tinx(-1x(Pout/Pin)^0.263))/n)
Where:
Tout - Temperature after turbo in rankine (R=*F+460)
Tin - Temperature before turbo in rankine
Pout - Pressure after turbo, absolute pressure ... ie ..you have 10lb of boost on the gauge.. add atmosphereic to get absolute
Pin - Pressure before turbo, often slight vacuum, absolute pressure
n - is the efficiency of the turbo... look at the turbo compressor map to determine where it falls in the efficiency range. Most average around 70%
plug in 70*F, 20.7 psia (6 psi boost), .7 for (n as in 70%) and you get a Tout of 158*F
Now, plug it into the density ratio equation to determine the density after the turbo.
DR = (Tin/Tout)*(Pout/Pin)
Same before, remember temperatures are in Rankines and pressures are absolute. DR comes out to be 1.24.
This means that the density of the air after the turbo is 1.24 more than the density than the inlet. Dout = Din * 1.24...
However, since the engine needs to be accomindated for the higher inlet temperatures the ignition timing is adjusted to compensate. The power output is the same even with the slight increase of air.
What's left is the pressure. That helps the engine by having to do less work, and recover lost power explained below.
Just doing an energy analysis on the engine or thermodynamics. The engine experiences a low pressure cycle, negative work, and a high pressure cycle, positive work. Add them together yields net work or what you see at the flywheel. The negative work is... pumping loss.
This is a general Pressure-Volume (P-V) diagram for an actual(opposed to ideal) 4 - stroke engine:
To further explain this diagram, the area inside loop is work, top minus bottom. It represents the 4 stroke in a single rpm in the range. Top side of the loop is compression, combustion and expansion. While the bottom is exhaust and intake.
This is an even more detailed general P-V Diagram:
You can get a general idea at each phase what internally is happening inside the engine. Meaning pressure increasing as volume is shrinking during compression. Pressure growing at combustion. And most noticeably, intake pressures falling below atmosphereic pressure. This takes work to create the vacuum, which means your engine is making less power to suck air in.
Notice that if intake did not fall below atmosphereic pressure that the area of the low pressure cycle would be smaller? And therefore, net work..power at the flywheel... would be larger.
And that's why a pressure increase actually helps the engine recover it's power.
I will not say a rear mount turbo cannot make more positive power. But it's all dependent on inlet temps.
Cheers.
Last edited by raremotive on Tue Jan 31, 2012 1:33 pm, edited 1 time in total.
-
New Jersey
- Posts: 127
- Joined: Tue Nov 16, 2010 9:09 am
- Car: 1997 Infiniti Q45
1990 Nissan 300ZX
Re: Rear Mount Turbo is very effective.
[quote="raremotive"
I will not say a rear mount turbo cannot make more positive power. But it's all dependent on inlet temps.
Cheers.[/quote]
exactly
I will not say a rear mount turbo cannot make more positive power. But it's all dependent on inlet temps.
Cheers.
exactly
-
NolimitZ32
- Posts: 7042
- Joined: Fri Jun 27, 2008 9:07 am
- Car: 91 AG2 2+0 TTMT swap/E39 BMW 540i6/E53 4.6is Dinan S3
- Location: Houston, TX
Re: Rear Mount Turbo is very effective.
Not disputing anything but I'm curious what size they were and what conditions were they running under?SBC300 wrote:I personally have seen it at least a dozen times in the last year.NolimitZ32 wrote:Ive seen instances of the Chinese turbos dropping the bearings but I don't recollect a single instance of the compressor wheel ever disintegrating, these turbos use thicker blades so technically they have less of a chance of disintegrating than say garret or MHI units. Its the pesky RB26DETT GT28s (the ceramic wheel ones) that have a tendency to let go when pushed to far.
(ie EJ22T)
-
BigTDogg (MA)

- Posts: 4194
- Joined: Wed Aug 29, 2007 8:26 am
- Car: 1990 Nissan 300ZX TT
- Location: Boston MA
Re: Rear Mount Turbo is very effective.
When the EJ255/257 turbo grenades, it often leaves shrapnel in the engine. Most VG30DETT engines that have turbos fail aren't nearly as catestrophic, from what I've seen, but that could all depend.
LOL @ New Jersey. If you're going to argue with the smart people, you might want to have some proof to back it up other than "google" and "street cred yo"
LOL @ New Jersey. If you're going to argue with the smart people, you might want to have some proof to back it up other than "google" and "street cred yo"
-
es.biggs

- Posts: 2120
- Joined: Sat Feb 20, 2010 10:32 am
- Car: 1990 300ZX 5sp NA
- Location: Charlotte, NC
Re: Rear Mount Turbo is very effective.
My parents, at one point, thought I was going to be smart like that guy - raremotive.
I work on cars now. LOL
I work on cars now. LOL
-
raremotive
- Posts: 3581
- Joined: Sun Oct 07, 2007 8:54 pm
- Car: 04 Infiniti G35
- Location: Stuck in the middle.
Re: Rear Mount Turbo is very effective.
Just graduated this December with my ME degree. And I been reading books to learn how things tick. I would like to do most of the work DIY, even tuning work. I will always be a student and continue striving to learn and improve. I am also trying to stay diverse rather than strictly automotive.
I would recommend Graham Bell "4 Stroke Performance Tuning" very good read. Not technical like what I did above, but very informative. It's like all of his tuning experience/knowledge worth in the book.

He has other books like forced induction performance, but it doesn't contribute much more than the above book.
I would recommend Graham Bell "4 Stroke Performance Tuning" very good read. Not technical like what I did above, but very informative. It's like all of his tuning experience/knowledge worth in the book.
He has other books like forced induction performance, but it doesn't contribute much more than the above book.
-
DCaff300ZX
- Posts: 4202
- Joined: Sun Jun 14, 2009 8:18 am
- Car: .
1993 CRP TT- Modified - Location: Tacoma, Washington
Re: Rear Mount Turbo is very effective.
Congrats on graduating!
Any plans for your Z32 project?
Any plans for your Z32 project?
-
es.biggs
- Posts: 2120
- Joined: Sat Feb 20, 2010 10:32 am
- Car: 1990 300ZX 5sp NA
- Location: Charlotte, NC
Re: Rear Mount Turbo is very effective.
That's that engineering mindset man. Always a good thingraremotive wrote:Just graduated this December with my ME degree....I will always be a student and continue striving to learn and improve.
-
raremotive
- Posts: 3581
- Joined: Sun Oct 07, 2007 8:54 pm
- Car: 04 Infiniti G35
- Location: Stuck in the middle.
Re: Rear Mount Turbo is very effective.
I am broke. I have $300 and a full tank of gas in the truck. Not to mention a stack of student loans. Right now it's job searching time. But once the pay check comes in, the fun begins.DCaff300ZX wrote:Congrats on graduating!
Any plans for your Z32 project?
-
BigTDogg (MA)
- Posts: 4194
- Joined: Wed Aug 29, 2007 8:26 am
- Car: 1990 Nissan 300ZX TT
- Location: Boston MA
Re: Rear Mount Turbo is very effective.
Find me on LinkedIN. Tony Ferraro. Perhaps someone in my network is looking to hire, I still get calls from recruiters all the time. If you didn't know I'm a Senior Mechanical Engineer with 12 years experience.raremotive wrote:I am broke. I have $300 and a full tank of gas in the truck. Not to mention a stack of student loans. Right now it's job searching time. But once the pay check comes in, the fun begins.DCaff300ZX wrote:Congrats on graduating!
Any plans for your Z32 project?
Congrats on gradumatating
-
DCaff300ZX
- Posts: 4202
- Joined: Sun Jun 14, 2009 8:18 am
- Car: .
1993 CRP TT- Modified - Location: Tacoma, Washington
Re: Rear Mount Turbo is very effective.
WOW, brains AND balls...I wish you the best, and hope that your obvious talents get noticed quickly and start paying off even quicker.raremotive wrote:I am broke. I have $300 and a full tank of gas in the truck. Not to mention a stack of student loans. Right now it's job searching time. But once the pay check comes in, the fun begins.DCaff300ZX wrote:Congrats on graduating!
Any plans for your Z32 project?
-
raremotive
- Posts: 3581
- Joined: Sun Oct 07, 2007 8:54 pm
- Car: 04 Infiniti G35
- Location: Stuck in the middle.
Re: Rear Mount Turbo is very effective.
Yep, not working for a semester took what I had left. I decided it was the school's best interest to train a new RA that could stay a full year (and more) than having to find a replacement once I left. Plus they would miss the valuable training at the beginning of the school year. So about $3600 of living expenses disappeared from my bank at the cost of a very fun and relaxing last semester. I am staying at my mother's house for the time being. So everything works out.DCaff300ZX wrote: WOW, brains AND balls...I wish you the best, and hope that your obvious talents get noticed quickly and start paying off even quicker.
But this is not the first time that I put myself last. I used to work for FedEx ground at night. But my living was being compromised so I ended up being hired as an RA to live at the dorms. Around August I told FedEx that I will be leaving last week of October. During that time the other guy gave his two week notice and didn't show up the next day, Rapid City outbound there are two people who work that shift. So I stayed much longer for them to be able to train two other people in order to replace the other guy and me. So to paint the picture better I was working a 20+ hour job at FedEx, then 25+ hour at RA and 17 credit hour class load for 6 months. It took a toll on me and my grades. But in the end, the only reward I get is knowing that the service manager who was salary paid did not have to work more for his money and he could get more time with his wife and daughter. I also won "outstanding first year RA of the year" by the favor of residents of the dorms.
Life wasn't/isn't that bad for me either. I own a fully paid for truck. I have no debts aside from the student loans. The only trouble is I am full of dreams.
Will do.BigTDogg (MA) wrote:
Find me on LinkedIN. Tony Ferraro. Perhaps someone in my network is looking to hire, I still get calls from recruiters all the time. If you didn't know I'm a Senior Mechanical Engineer with 12 years experience.
Congrats on gradumatating
Man looking back. Team of three automated a remote control tank. I was the only one who knew programming.
This is the tank using an ultra sonic sensor to sense a in-range target. The rotation position was using a non-linear resistance potentiometer.
http://static.ak.fbcdn.net/rsrc.php/v1/ ... 00408&ev=0
-
YoungZ1990
- Posts: 2
- Joined: Sat May 11, 2013 3:01 pm
- Car: 1990 Nissan 300zx NA-T 2+0
Re: Rear Mount Turbo is very effective.
He's mine fellas. I'm New to this group 

-
H1tman
- Posts: 136
- Joined: Wed Mar 14, 2012 3:38 pm
- Car: '90 300zx 2+2 Azure Blue
- Location: Temecula, CA
Re: Rear Mount Turbo is very effective.
Ah, you're the dude with the red RT z32 on FB. Welcome!
-
YoungZ1990
- Posts: 2
- Joined: Sat May 11, 2013 3:01 pm
- Car: 1990 Nissan 300zx NA-T 2+0
Re: Rear Mount Turbo is very effective.
yep thats me lol
Re: Rear Mount Turbo is very effective.
So its been years since I posted my tinkering around with a rear mount turbo on my 90 300zx. For the record the engine did not grenade because of the turbo. I was upgrading the intercooler when shavings from one of the pipings Id forgotten got to clean got into one of the cylinders and fragged a piston. This was turbo was an exercise to see if it could be done on a z and it can. These days rear mounts are found on just about anything. My current car a corvette proves a twin turbo rear mounted set up is a beautiful thing. Still proud to say I was one of the first to do iton a 300zx . Peace
-
gainesb2003
- Posts: 5
- Joined: Sun Jan 31, 2016 5:21 pm
Re: Rear Mount Turbo is very effective.
What tuning options are used for the rear mount turbo setup.. Nistune/stock TT ECU/ Chip flash. I am also thinking of doing this on my N/A but the tuning ??s hold me back.