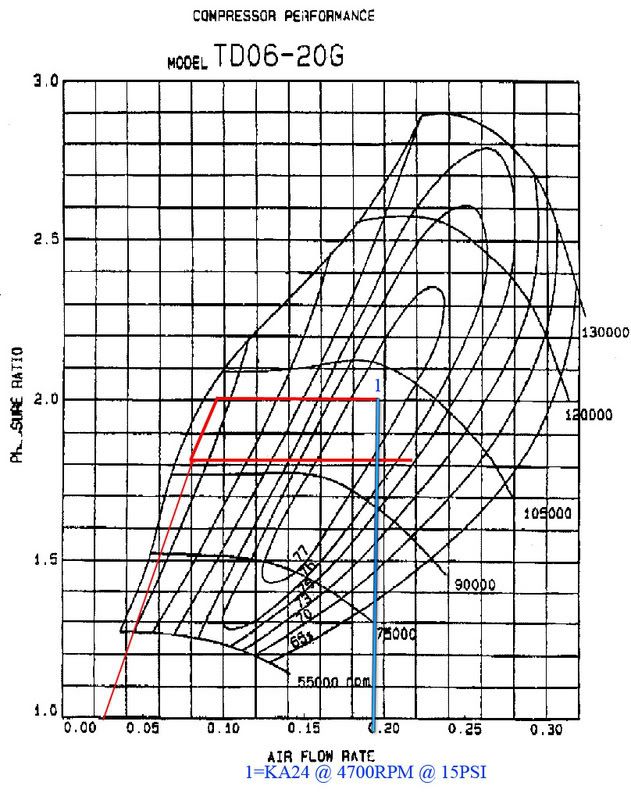
Here's one I made for a 20G many many moons ago. I haven't double checked it though.
quick and dirty way of reading compressor maps:
Your Y- axis is what they call pressure ratio.
skip this if you don't care about the theory: This is calculated by using the equation of ((incoming air pressure + boost pressure)/incoming air pressure). Really this is just an all-encompassing statement for "boost". It allows you to calculate airflow both in single turbo units, as well as twin charger units, and sequential turbos (meaning turbos that have compressed air coming into them, not just atmospheric). Seeing as how we pretty much always deal with single turbo setups that intake atmospheric pressure, read the next part:
if you skipped the above part, or couldn't understand it, read this dumbed down version: The y axis is boost.
~1.5 on the chart is about 8 psi.
~1.7 is about 10 psi.
~2 is about 15 psi.
The X axis: The X axis is airflow. What is airflow? Its power. The more air you shove into your engine, the more fuel you can shove in there too... when these 2 babies get together in a menage a trois with a spark plug, magic things happen.
SCIENCE ALERT!Unfortunately there is no standard for measuring airflow. Some compressor maps are in lb/min, some are in CFM, some are in KG/s, and I'm probably missing one or 2. The easiest one to understand is probably lb/min. A VERY rough estimate of power based on airflow is can be seen as (airflow in lb/min)*10=hp. What about the other metrics of airflow? For purposes of keeping this simple, just hit up google for a unit converter. Punch in "Kg/s to lb/min converter" or something, and one will come up. From there, you can relate back to lb/min, and from there, power!
ok, science alert over
What about those islands and donuts and crap? What are they all about?
Those are efficiency islands. You can usually see a number written on them somewhere in the compressor map. Basically, the higher the efficiency, the better the turbo is performing. That one in the middle? That's the "sweet spot". If you match the sweet spot of the turbo with the sweet spot of your engine, hold the frig on. That will most likely be your peak torque area. If you end up in the sweet spot at redline, that just means you probably have a turbo that is just slightly too big, but you'll pull strong to redline.
What about those other lines that sort of go left to right across the graph?
That's the RPM your turbo is spinning. For our purposes... don't worry about that.